The Big Picture
The screenshot below illustrates the main components of Aquila.
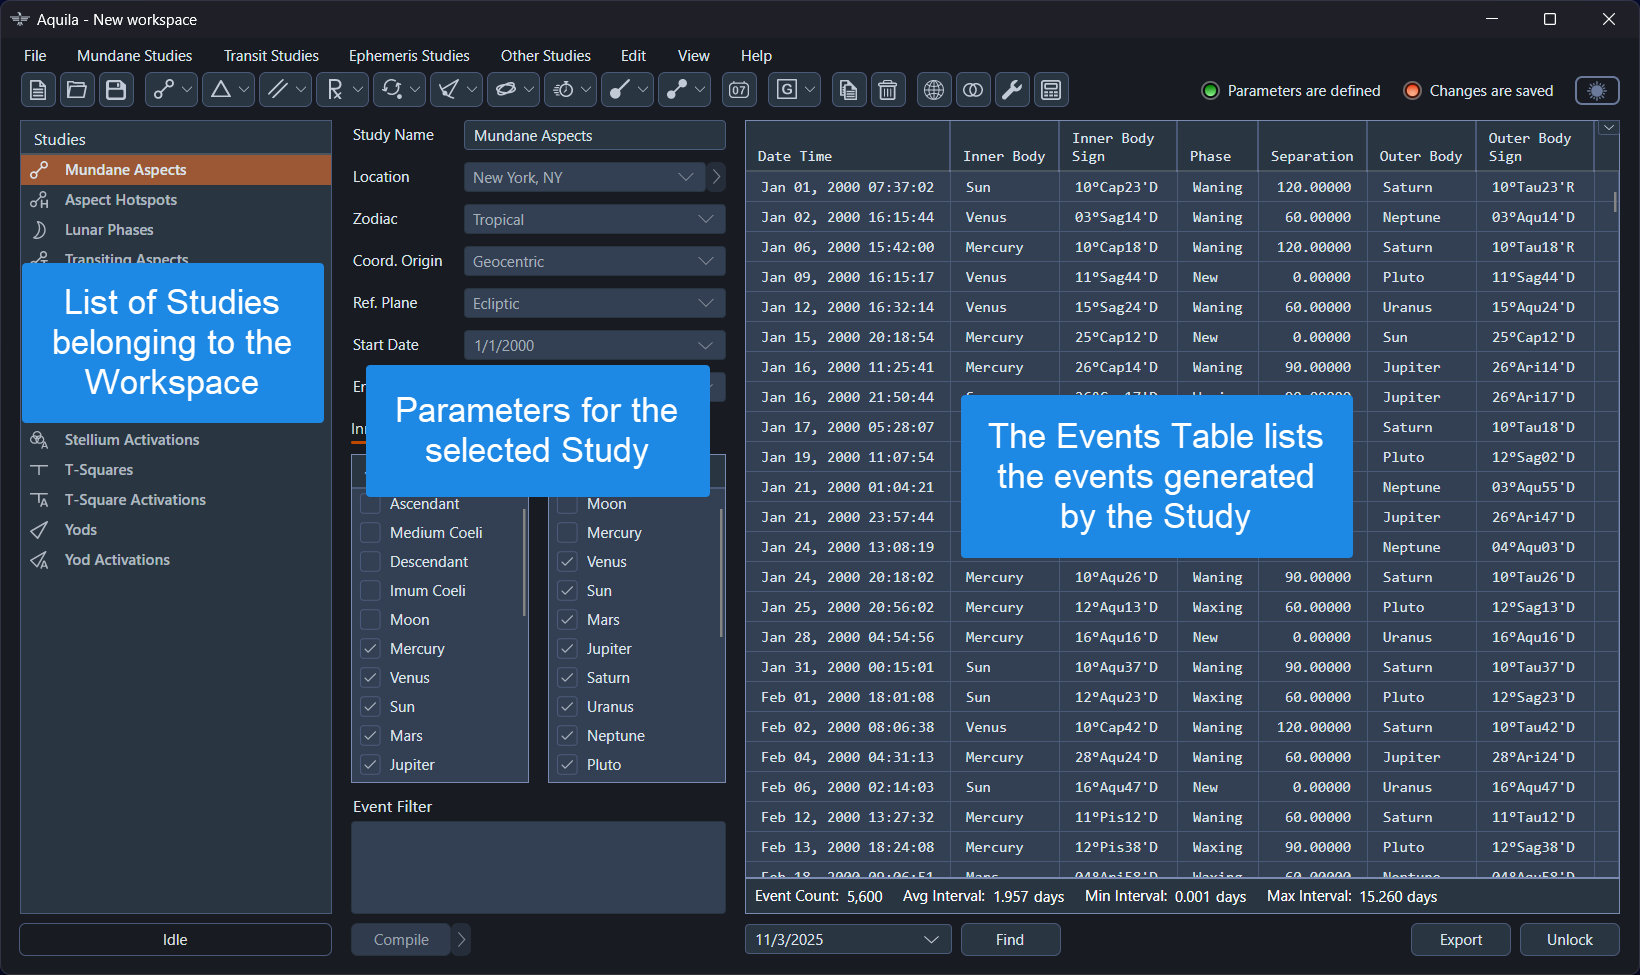 Overview of the Aquila application
The application's main window consists of a menu, a toolbar, and three distinct panels, each serving a specific purpose in the workflow:
-
Studies Pane: Located on the left, this panel lists all the studies that have been added to the current workspace. To work with an already created study, select it from this list.
-
Parameters Pane: Positioned in the middle, this panel is where you define the parameters for the currently selected study. These settings control exactly what events will be generated when the study is run.
-
Events Data Grid: On the right, this table lists the events generated by a study after it has been run. It's designed for clarity and performance, capable of handling millions of events. You can customize the table's appearance and export the data for use in other applications.
The general workflow follows this logical sequence:
- Create a Study: To begin, create a new generator study by selecting from
Mundane StudiesorTransit Studieson the main menu or by clicking its corresponding button on the toolbar. The new study is automatically selected, and its settings will appear in the Parameters Pane. - Define Parameters: Adjust the settings in the Parameters Pane to meet your research needs. This is where you'll define the ephemeris, time frame, celestial bodies, and other settings for the study.
- Run the Study: Click the
Runbutton, located at the bottom of the events data grid. TheRunbutton will remain disabled until all required parameters have been set. - Analyze Results: Review the generated events in the events data grid. This high-performance table is designed to handle millions of events and can be customized by reordering, hiding, or showing columns. You can also export the data to a CSV file or copy selections of events for use in other applications. Once events are generated, the study becomes locked to ensure the events data grid accurately reflects the study parameters. Click the
Unlockbutton to modify the study parameters. - Create a Timeline Study: Optionally, create a Timeline Study to aggregate events from multiple generator studies into a single, chronologically ordered timeline. This provides a high-level perspective by simplifying the data into a two-column view of dates and event descriptions, allowing you to see the overarching narrative without switching between individual studies.