Ephemeris Data Grid
After generating an ephemeris, the data appears in a tabular data grid on the right side of the study view. Each row represents one point in time, and columns display the date/time and metric values for each selected body.
Grid Layout
The data grid contains:
- Date Time column -- The date and time of each record, always displayed as the first column
- Body metric columns -- One column for each combination of selected body and selected metric (e.g., "Sun Longitude", "Moon Sign", "Venus Speed")
- For aspect studies, additional aspect metric columns for each inner-outer body pair
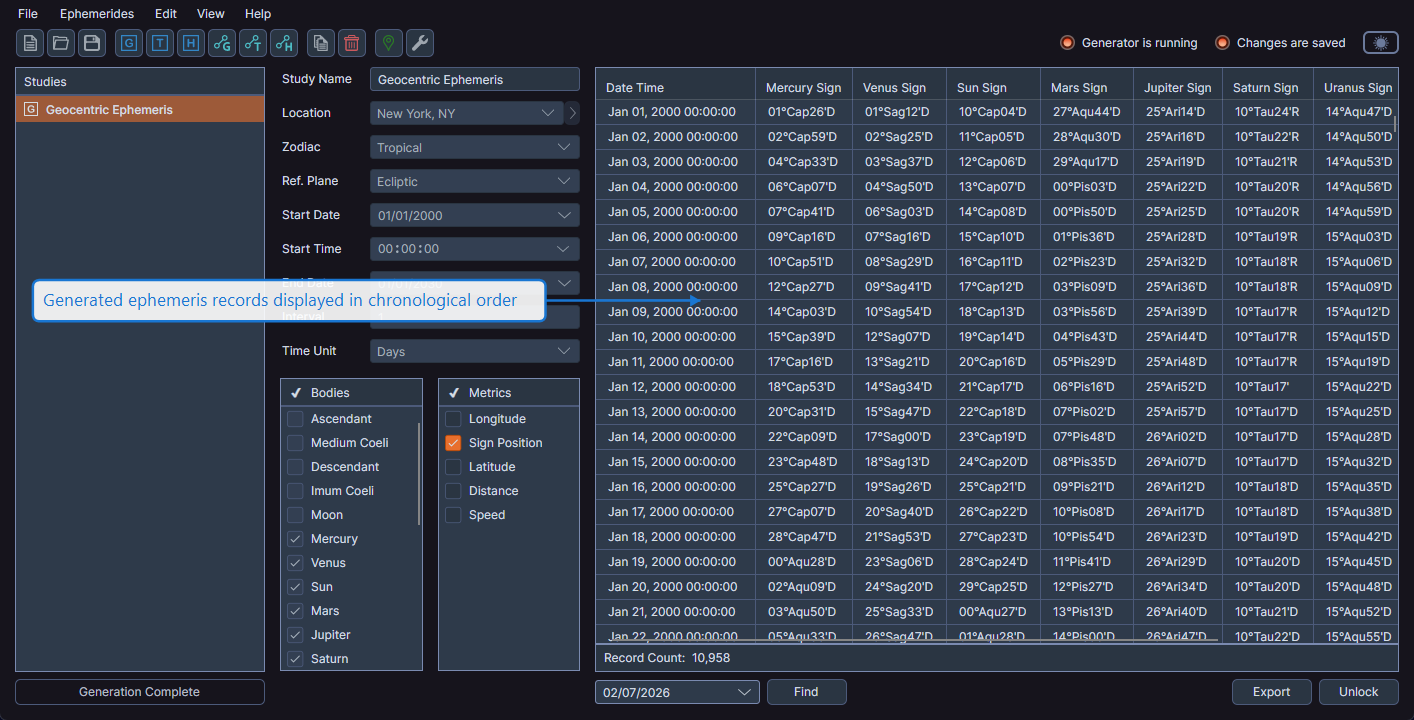
Records always appear in chronological order from the start date to the end date of the study.
Column Customization
You can customize the data grid layout in several ways:
- Reorder columns by dragging column headers to a new position
- Resize columns by dragging the border between column headers
- Toggle visibility by right-clicking any column header to access the visibility menu (see Column Visibility Toggle)
Column layout customizations (visibility, order, and width) are saved with the study in the workspace file. Your layout preferences are preserved when you save and reopen the workspace.
Row Selection
Click on a row to select it. You can select multiple rows by holding Ctrl (Windows) or Cmd (macOS) while clicking, or select a range by holding Shift and clicking. Multi-row selection is useful when copying record data.